TO profit from a straddle position, One should be able to calculate, historically, how many times did the stock move beyond the premium one would pay for the STRADDLE Position. For example, If a Straddle on a stock costs $4, It makes sense to check how many times in the past did the stock move more than $4, UP or DOWN. I.e if the option expires in 30 days, one needs to find out on any given 30 days in the past, how many times has the stock moved beyond $4. This is only one of the many things one needs to do before buying or selling straddles. This combined with the Volatility Cones and calculation of "Average" spread between Realized Volatility and Implied Volatility should give an investor some information to trade them. One can also look into "Strangle".
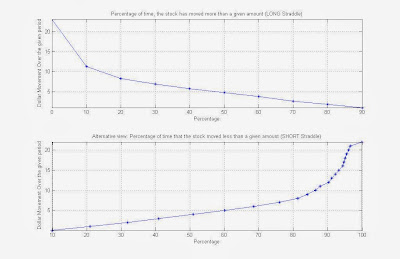
Here is a figure that shows a stocks historical movements over the past 3 years for a 30 day rolling window period.

One can see from the chart that in the past 3 years, CNH has moved beyond $5 only 50% of the time, 60% more than $3.8, 70% more than $2.66 etc. So if a straddle costs only $2.66, then Historically, 70% of the time it has moved more than $2.66 in 30 days. On the other side, there is still a 30% chance that it will not move beyond $2.66.
MATLAB CODE:
Backtest_Straddles.m