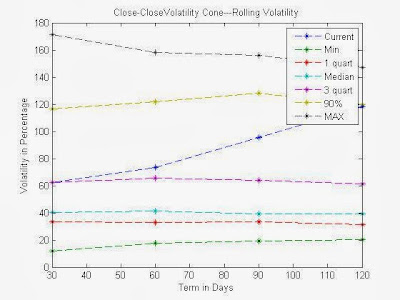
This post describes what volatility cones are and how I usually use them. As with many of my posts, I will attach code to this post.
Volatility cones are a graphical representation of realized volatility ranges over different time horizons such as 30,60,90,120 days. It gives a volatility distribution. It puts the current implied volatility into perspective. Some quotes from the book volatility trading by euan sinclair :
" The volatility cone is very useful for placing current market information (realized volatility, implied volatility and the spread between them) into historical context.We may be best served by comparing implied volatility to the historical volatility distribution given by the volatility cone. Selling one-month implied volatility at 35% because this is in the 90th percentile for one-month volatility over the past 2 years can form the basis of a sensible trading plan."
One needs to calculate the spread between 30 day rolling close to close volatility and the Implied Volatility. One needs to calculate the AVERAGE of the above spread over a sufficient time period. If the spread is Above normal then one needs to look carefully as an opportunity to trade.
As an Example, The above plot shows the Volatility cone of stock : CNH as of today 06/29/2009
The 30, 60, 90, and 120 day rolling volatilities and their percentiles are shown below and plotted above in the figure.
30 60 90 120
-----------------------------------
Current: 0.6252 0.7363 0.9564 1.1798
Min: 0.1205 0.177 0.19 0.2023
25% : 0.3324 0.3301 0.3318 0.3149
50% : 0.4039 0.4118 0.3943 0.3924
75%: 0.6239 0.6538 0.639 0.6148
90%: 1.1666 1.2162 1.2797 1.1961
MAX: 1.7115 1.5827 1.5581 1.4694
As you can see from the above table, CNH 60 day volatility has varied from a minimum of 17.7% to a maximum of 158%. The close price today is $14.32. The nearest Strike for 08/22/2009 Expiration is $15. The Implied Volatility of the call Option is 69.5 ( from Options Express website). The number of days to Expiry is 53. The Implied vol of 69.5 falls between 75% to 90% . So Approx 80% of the time in the past 4 years, the Realized Volatility of 60 days has been below that number of 69.5%. So we are in the third quartile. Whether this is high enough to sell the implied volatility or not depends on the person's risk appetite. This information gives me confidence in making the trade intelligently.
Code:
Please download all the three files into the same directory and run VolCones_CC.m
VolCones_CC.m
EstimateVol_CC.m
hist_stock_data.m