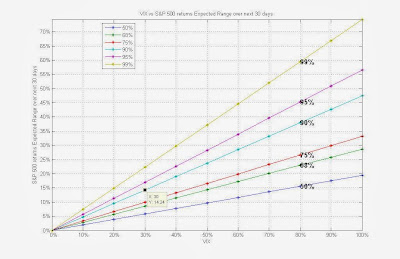
As you can see from the Above figure, one can easily figure out the expected range of S&P 500 Returns with a given VIX Level for a given Probability. For example, Currently the VIX level is 30%. So looking at the above plot, for 90% Probability,30% VIX,on the X-Axis and following it vertically and across, we can see that over the next 30 days, the expected range for S&P 500 Returns is +/- 14.24% .
In general, The linear relationship is as follows:
Expected Range with 50% Probability = 0.1947 * VIX
Expected Range with 68% Probability = 0.2871 * VIX
Expected Range with 75% Probability = 0.3321* VIX
Expected Range with 90% Probability = 0.4748* VIX
Expected Range with 95% Probability = 0.5658 * VIX
Expected Range with 99% Probability = 0.7436 * VIX
Now I show how I derived the Above Plot
% probabilities
p = [0.50 0.68 0.75 0.90 0.95 0.99]
% Properly adjust those probabilities to be passed into norminv program
p2 = 0.50 + p./2;
% Before we proceed we should make an important assumption that
% The rate of return on the S&P 500 over the next 30 days is normally
% distributed
% USe the norminv command to get the number of standard deviations
% that a number drawn from unit normal distribution will be
nstd = norminv(p2,0,1);
% since VIX is is an annualized standard deviation, We divide the values
% Obtainded above by sqrt(12)
nstd = nstd ./ sqrt(12);
% Now the Linear Relationship between Level of VIX and S&P 500 return range
% would be: ExpRangeSP500 = nstd .* VIX
% Now let us plot using various values of VIX
VIX = 0:10:100;
ExpRangeSP500 = nstd' * VIX;
%%PLOT
plot(VIX,ExpRangeSP500,'-*')
set(gca,'YTick',[0:5:max(ExpRangeSP500(:))])
set(gca,'YtickLabel',cellstr(strcat(num2str([0:5:max(ExpRangeSP500(:))]'),'%')))
set(gca,'XTickLabel',cellstr(strcat(num2str(VIX'),'%')))
title('VIX vs S&P 500 returns Expected Range over next 30 days')
xlabel('VIX')
ylabel('S&P 500 returns Expected Range over next 30 days')
plottitles = strcat(cellstr(num2str(p' .*100)),'%');
legend(plottitles,'Location','best')
text(VIX(9)*ones(6,1),ExpRangeSP500(:,9),plottitles,'FontSize',14,'FontWeight','bold')
grid on
axis tight
3 comments:
When you calculate the expecte range of returns over the next 30 days, are you using calendar days or trading days?
Can you show me wich would be the relationship over the next 60 days and 90 days.
Thanks.
Most in depth study of VIX vs S&P, i have ever seen. Is it ok for me to use this on my site http://www.binarytrends.com
Ways & Works Consulting is an ISO 9001:2015 certified HR Consulting Firm, Manpower Recruitment and Practical Training firm career with an aim to provide value aided service to employers Best recruitment agencies industry we serve . with an in-depth understanding of their requirements. We are working as a perfect bridge between the employer and employee to fulfil their needs by placing the best suitable at place.
Post a Comment