Monday, November 17, 2008

Sample Size Determination and History behind Rules of Thumbs( Why 22? Why 25? Why 30?)

Sample Size equation that is predicated on Central Limit Theorem


Correction Factor for Sample Size based on finite Population Size


For a 95% Level, Z = 1.96. Let us say that we want the result to be within 5% error--Confidence Interval and lets have P varying
from 0.1 to 0.9. Then inserting the above numbers into the equation, we get:
ConfidenceInterval = 0.05;Z = 1.96;

P = 0.1:0.1:0.9;
SampleSize = [Z^2 .* P .* (1-P)]/(ConfidenceInterval^2);
SampleSizeRequired = [P ;SampleSize].'
SampleSizeRequired =
0.1000 138.2976
0.2000 245.8624
0.3000 322.6944
0.4000 368.7936
0.5000 384.1600
0.6000 368.7936
0.7000 322.6944
0.8000 245.8624
0.9000 138.2976

Plot of SampleSize Required vs Probability:

figure()

plot(SampleSizeRequired(:,1),SampleSizeRequired(:,2))

xlabel('Probability P')

ylabel('Sample Size Required')


T-distribution table VS Sample Size and closeness to Standard Normal:

(Source: Jeffrey Russell NOTES)

T distribution with n-1 degrees of freedom at 0.05 level( 95%) It becomes normal when T is Approx 2 ( 1.96 to be exact)
% T     n

[4.303 3
2.228 11
2.086 21
2.042 31
2.00 61];

% As can be seen above Starting from about 21 we can see it get closer to 2

Survey Example: Some tests for Sample Sizes:

(Source: Jeffrey Russell NOTES)

Assume IID (Independent Identical distribution). So now let us say we
need to do a survey. Let us assume that we have
ONLY 21 (From the above Table) people to survey from.

After survey we found that 60% People say A and 40% say B. Now We need to find out if it is significant or not. We need to find out by calculating

% the T-stat and comparing it with 2 (1.96 to be exact).

NULL HYPOTHESIS:

IT IS TIE (50-50). I.e Even though 60% of the people say A, we want to make sure it is different from being a TIE (50-50)
when a bigger population is considered.

T-stat formula ( Any Basic Stats Textbook is the source here)


T_Stat = (P - p0)/sqrt(p0 * (1-p0)/n); Where p0 is NULL hypothesis. (0.50 in our case)

% Now lets put some values into the equation:

P = 0.60; p0 = 0.50;%( NULL Hypothesis)
n = 21;
t_stat = (P - p0)/sqrt(p0 * (1-p0)/n)
t_stat = 0.9165
% We GOT 0.9165 Which is LESS than 2. So we FAIL to reject the NULL
% Hypothesis. So we cannot say with certainty that it is NOT a TIE.

% Now lets increase the n to 30.
n=30;
t_stat = (P - p0)/sqrt(p0 * (1-p0)/n)

t_stat = 1.0954

% We GOT 1.0954 Which is STILL LESS than 2. So we FAIL to reject the NULL
% Hypothesis. So we cannot say with certainty that it is NOT a TIE.

% Now lets go further and calculate it for a bunch of n
n = 30:10:100;
t_stat = (P - p0)./sqrt(p0 * (1-p0)./n);

figure()
plot(n,t_stat)
xlabel('Sample Size')
ylabel('T stat')

% BINGO: We got it. So at a sample Size of 100, we get Exactly what we
% wanted. We REJECT the NULL Hypothesis that It was a TIE and declare A as
% our winner in the survey.
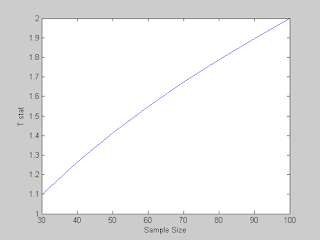


Reverse Experiment: calculating Percentages Needed with a given Sample Size to have statistical significance.

% So here we need to find out for what P value is needed.

% With Some Linear Algebraic Manipulations, we get:

% Now find out for different n , what P is needed..

n = 21:30;
P = p0 + [2 * sqrt(p0 * (1-p0)./n)];

figure()

plot(n,P)

xlabel('Sample Size')

ylabel('Probability Needed to have statistical siginificance')


% For Larger Samples:

n = 30:1000;
P = p0 + [2 * sqrt(p0 * (1-p0)./n)];

figure()

plot(n,P)

xlabel('Sample Size')

ylabel('Probability Needed to have statistical siginificance')


S
ee How the PLOT flattens out after certain number of Samples( >450).
That is why most of the proffessional Pollsters pick a sample size of Approximately 500


History behind "Rules-of-thumb" (Why 22? 25? 30?)

(Source: iSixSigma)

n=22 was proposed by Fisher in Statistical Mehthod, p. 44, when he reviewed the impact of the the exeeding of the standard deviation once in evey three trials. Twice the standard deviation is exceeded in about 22 trials "For p-value = 0.05, or 1 in 20 and 1.96 or nearly 2; it is convenient to take the point as a limit in judging whether a deviation is to be condisered significant or not. Deviations exceeding twice the standard deviation are thus formally regarded as significant. Using this criterion we should be led to follow up a false indication only once in 22 trials even if the statsitics were the only guide. Small effects will still escape notice if the data are insufficiently numerous to bring them out, but lowering of the standard of signficicance meet this difficulty.

n = 25 has a truly statistical justification. At n = 25 the Law of Large numbers will start to show a pronounced symmetric/normal distribution of the sample means around the population mean. This normal distribution becomes more pronounced as n is increased.

n = 30 comes from a quote from Student (Gosset) in a 1908 paper "On the probable error of a Correlation" in Biometrika. In this paper he reviews the error associated with drawing of two independent samples from infinitely large population and their correlation (not the individual errors of each sample relative to the sample mean and the population mean!). The text reviews
different corrections to the correlation coefficient given various forms of the joint distribution. In a few sentences, Student says that at n = 30 (which is his own experience) the correction factors don't make a big difference.

Later, Fisher showed that the sample for a correlation needs to be determined based on a z-transformation of the correlation. So, Student's argument is only interesting historically. Also, Student wrote his introduction of the t-test in Biometrika during the same year (his
prior article). Historically, the n = 30 discussed in his correlation paper has been confused with the t-test paper, which only introduced the t-statistic up to sample size 10.


References:


2. http://www.isixsigma.com/


3. http://www.itl.nist.gov/div898/handbook/ppc/section3/ppc333.htm


4. http://www.itl.nist.gov/div898/handbook/prc/section2/prc222.htm


5. http://www.itl.nist.gov/div898/handbook/prc/section2/prc243.htm


Sunday, July 27, 2008

Black Litterman Model in MATLAB (He & litterman implementation)

HeLitterman
MATLAB Implementation of Black Litterman Model

This code implements the Black and Litterman Model As given in the paper He & Litterman: The intuition Behind Black- Litterman
Model Portfolios.

% First The Inputs:

% Correlation Matrix: Page 18
Corrmat = ...
[1,0.4880,0.4780,0.5150,0.4390,0.5120,0.4910;
0.4880,1,0.6640,0.6550,0.3100,0.6080,0.7790;
0.4780,0.6640,1,0.8610,0.3550,0.7830,0.6680;
0.5150,0.6550,0.8610,1,0.3540,0.7770,0.6530;
0.4390,0.3100,0.3550,0.3540,1,0.4050,0.3060;
0.5120,0.6080,0.7830,0.7770,0.4050,1,0.6520;
0.4910,0.7790,0.6680,0.6530,0.3060,0.6520,1;];

% Risk Aversion Parameter---Page 10
RiskAversion = 2.5;

% Standard Deviations and Market Capitalization Weights--Table 2 Page 19
stdevs = ...
[16.0000
20.3000
24.8000
27.1000
21.0000
20.0000
18.7000]./100;

MktWeight = ...
[ 1.6000
2.2000
5.2000
5.5000
11.6000
12.4000
61.5000]./100;

tau = 0.05;

Market Equilibrium Risk Premiums : THE PI


Equation 2 Page 3 PI = RiskAversion * Covariance * MktWeight

% Need to Convert Correlation into Covariance

Covmat = Corrmat .* (stdevs * stdevs');

% Now we have everything to implement the Equation
%EqRiskPrem = RiskAversion * Covmat * MktWeight;
EqRiskPrem = RiskAversion * Covmat * MktWeight;
% Print Out Table 2 in Page 19
AssetNames = {'Australia','Canada','France','Germany','Japan',...
'UK','USA'};

Table2 = [{'Assets' 'Std Dev' 'Weq' 'PI'};
{'------' '------' '---' '--'};
AssetNames' num2cell([stdevs MktWeight EqRiskPrem]*100)]

Table2 =

'Assets' 'Std Dev' 'Weq' 'PI'
'------' '------' '---' '--'
'Australia' [ 16] [ 1.6000] [3.9376]
'Canada' [20.3000] [ 2.2000] [6.9152]
'France' [24.8000] [ 5.2000] [8.3581]
'Germany' [27.1000] [ 5.5000] [9.0272]
'Japan' [ 21] [11.6000] [4.3028]
'UK' [ 20] [12.4000] [6.7677]
'USA' [18.7000] [61.5000] [7.5600]

Views Based Optimal Weights

%View1 is The German Equity Market Will Outperform the rest of European

% Markets by 5% a year.
P = [ 0 %Australia
0 %Canada
-29.5 %France
100 %Germany
0 %Japan
-70.5 %UK
0]'./100; %USA

Q = 5/100;
% The Black Litterman Expected Returns are Calculated
% By Equation 8 and the Optimal Portfolio Weights are
% Calculated By
%RiskAversion * Covariance * ExpectedReturns(MU)
% Lambda = 0.302; Page 11

Omega = diag(diag(P*tau*Covmat*P'));


% Equation 8--Expected Returns : MU
PostCov = inv(inv(tau*Covmat) + (P' * inv(Omega) * P));
SigmaP = Covmat + PostCov;
ExpRet=inv(inv(tau*SigmaP)+P'*inv(Omega)*P)* ...
(inv(tau*SigmaP)*EqRiskPrem +P'*inv(Omega)*Q);
% ExpRet = inv(inv(tau*Covmat) + P' * inv(Omega) * P) * ...
%(inv(tau*Covmat) * EqRiskPrem + P' * inv(Omega) * Q);

% Optimal Weights
OptimalWeights = (1/RiskAversion)* inv(SigmaP) * ExpRet;

Tab4Col4 = OptimalWeights - (MktWeight)/(1+tau);

Table4 = [{'Assets' 'P' 'MU' 'W' 'W - Weq/1+tau'};
{'------' '--' '---' '--' '-------------'};
AssetNames' num2cell([P' ExpRet OptimalWeights ...
round(Tab4Col4 * 1000)./1000]*100)]

Table4 =

'Assets' 'P' 'MU' 'W' 'W - Weq/1+tau'
'------' '--' '---' '--' '-------------'
'Australia' [ 0] [ 4.3328] [ 1.5238] [ 0]
'Canada' [ 0] [ 7.5838] [ 2.0952] [ 0]
'France' [-29.5000] [ 9.2991] [-4.0555] [ -9]
'Germany' [ 100] [11.0615] [35.7733] [ 30.5000]
'Japan' [ 0] [ 4.5087] [11.0476] [ 0]
'UK' [-70.5000] [ 6.9550] [-9.7178] [ -21.5000]
'USA' [ 0] [ 8.0756] [58.5714] [ 0]


Saturday, July 19, 2008

Implied Jump for stocks Before an Important Announcement

I always used to wonder how much jump in prices is the market really implying right before an earnings or another important announcement. My research regarding the concept led me to this book " Volatility Trading" by euan sinclair. There he clearly shows how to calculate the implied jump in the stock by options prices. The Strategy is to sell the options so that one can take advantage of the fact that implied volatility usually drops after an announcement. So we will be basically short volatility. one should also expect that the front month implied volatility should be greater than that of further expiration implied volatility.

First, assuming, sigma_1 as the front month implied volatility and sigma_2 as the second month implied volatility, forward volatility,

sigma_12 is given by


The volatilty attributed to the event is the difference between front month volatility and forward volatility.

Sigma_E =


The Expected Jump is :


A Trader needs to compare this estimate to that of his own estimate of how much the stock is going to jump after the announcement and should trade accordingly. Not definitely for the faint hearted.

Thursday, June 19, 2008

Combining Market Depth and Tick Files

What is MARKET Depth ?? Market Depth is another name for Order book information. Order Book displays 5-10 levels of Bid and Offer Prices along with the volume sizes. this is very useful information for high frequency trading. Order Book tells us about what state the market is in. The amount of data is huge. Here I give some tips and useful information in how to combine the Order book Data with the Time & sales Tick Data.

CME usually provides 5 levels of information for futures contracts.
So, To construct a sequential price flow, we need to combine the Depth and Tick Data. By doing this, we can reconstruct the price action that has taken place in the market.

It is best to work with the Best Bid Best Offer and Time and sales data to reduce the memory requirement.

Always, Market Depth Updates first and then trade gets updated. If one is collecting the data, one needs to note down the Time stamps (upto msec level) and the corresponding Data.

For Example:

Depth Update 08:30:01.324 1925.50 1925.75
Trade Update 08:30:01.325 1925.75 500 (volume)

As you can see, one needs to see the time stamp for the last trade and see what was the best bid and best offer right before it and then combine the both into one row as follows:

08:30:01.325 1925.50 1925.75 1925.75 500

This gives a better picture of what really happened.

Sunday, June 15, 2008

Intraday Trading---Converting Ticks into Bars

Sometimes it is easier to work with bars instead of ticks. In such cases, If we have Raw Tick Data, The following matlab programs would do the work for you. It is a collection of various methods that could be used to construct bars.

Tick2bar program at the matlab file exchange:


http://www.mathworks.com/matlabcentral/fileexchange/loadFile.do?objectId=3398

Another method that was posted at a forum http://www.nuclearphynance.com/


% numberOfBarsPerDay: 24 = 1 hour bars (60 minutes)
% 48 = 30 minute bars (24*60)/30
% 72 = 20 minute bars (24*60)/20
% 96 = 15 minute bars (24*60)/15
% 144 = 10 minute bars (24*60)/10
% 288 = 5 minute bars (24*60)/5
% 1440 = 1 minute bars (24*60)/1
%%--------------------------------------------------------------------------

numberOfBarsPerDay=24;
x=Bid;
datetimeGrid=(floor(datetime.*numberOfBarsPerDay))./numberOfBarsPerDay;
timeChgPointIndex=find(diff(datetimeGrid)~=0);
intervalDatetimeStart=datetimeGrid(timeChgPointIndex);
intervalDatetimeEnd=datetimeGrid(timeChgPointIndex+1);
intervalDatetimeActual=datetime(timeChgPointIndex);
intervalData=x(timeChgPointIndex);


3. Another method using histc
[numberInInterval,intervalIndex]=histc(datetime,intervals);

Creating Market profile with MATLAB


Some Day Traders use CBOT Market Profile for Day Trading purposes. I am NOT a fan of Technical Analysis, but nevertheless, I thought why not write a matlab program to create one.

Here is a quote from CBOT----

Market Profile is a graphical organization of price and time information. Market Profile displays price on the vertical axis and time on the horizontal axis. Letters are used to symbolize time brackets. marketprofile is an analytical decision support tool for traders—not a trading system.


CBOT Overview:


CBOT Examples:


MATLAB CODE:

% clear all
% clc;
% %assuming tick by tick data
% data = load('may01d.mat');
% ESdata = data.ESlast;
ESdata=close;

ESprices=unique(ESdata);
bars=20;
timertick=1;
periods=floor(size(ESdata,1)/(timertick*bars));
MP=zeros(size(ESprices,1),periods);
for i=1:periods
g=ESdata(timertick*bars*(i-1)+1:timertick*bars*i,1);
for m=1:size(g,1)
s=g(m);
s1=find(ESprices==s);
MP(s1,i)=i;
end
end

B = MP;%A(:,2:end) ;
B(B==0) = inf ;
B = sort(B,2) ; % sort each row
B(isinf(B)) = 0 ;

TPO=zeros(size(B));
for l=1:numel(B)
if B(l)~=0
TPO(l)=B(l)+64;
end
end


Final_MP={ESprices char(TPO)};

Estimate Historical Volatility

Here is the MATLAB code that one could use to estimate historical volatility using different methods

Historical Close-to-Close volatility
Historical High Low Parkinson Volatility
Historical Garman Klass Volatility
Historical Garman Klass Volatility modified by Yang and Zhang
Historical Roger and Satchell Volatility
Historical Yang and Zhang Volatility
Average of all the historical volatilities calculated above


function vol = EstimateVol(O,H,L,C,n)
% Estimate Volatility using different methods
% EstimateVol(O,H,L,C)gives an estimate of volatility based on Open, High,
% Low, Close prices.
% INPUTS:
% O--Open Price
% H--High Price
% L--Low Price
% C--Close Price
% n--Number of historical days used in the volatility estimate
% OUTPUT:
% Vol is a structure with volatilities using different methods.
% hccv -- Historical Close-to-Close volatility
% hhlv -- Historical High Low Parkinson Volatility
% hgkv -- Historical Garman Klass Volatility
% hgkvM -- Historical Garman Klass Volatility modified by Yang and Zhang
% hrsv -- Historical Roger and Satchell Volatility
% hyzv -- Historical Yang and Zhang Volatility
% AVGV -- Average of all the historical volatilities calculated above
% web: http://www.sitmo.com
try
OHLC = [O H L C];
catch %#ok
error('O H L C must be of the same size');
rethrow(lasterror);
end
if(n<=length(O))
fh = @(x) x(length(x)-n+1:end);
else
error('n should be less than or equal to the length of the prices')
end
open = fh(O); %O(length(O)-n+1:end);
high = fh(H); %H(length(H)-n+1:end);
low = fh(L); %L(length(L)-n+1:end);
close = fh(C); %C(length(C)-n+1:end);
Z = 252; %Number of trading Days in a year

vol.hccv = hccv();
vol.hhlv = hhlv();
vol.hgkv = hgkv();
vol.hgkvm = hgkvM();
vol.hrsv = hrsv();
vol.hyzv = hyzv();
vol.AVGV = mean(cell2mat(struct2cell(vol)));

function vol1 = hccv()
% historical close to close volatility
%Historical volatility calculation using close-to-close prices.

r = log(close(2:end)./close(1:end-1));
rbar = mean(r);
vol1 = sqrt((Z/(n-2)) * sum((r - rbar).^2));
end

function vol2 = hhlv()
%The Parkinson formula for estimating the historical volatility of an
%underlying based on high and low prices.

vol2 = sqrt((Z/(4*n*log(2))) * sum((log(high./low)).^2));
end

function vol3 = hgkv()
% The Garman and Klass estimator for estimating historical volatility
% assumes Brownian motion with zero drift and no opening jumps
%(i.e. the opening = close of the previous period). This estimator is
% 7.4 times more efficient than the close-to-close estimator.

vol3 = sqrt((Z/n)* sum((0.5*(log(high./low)).^2) - (2*log(2) - 1).*(log(close./open)).^2));

end

function vol4 = hgkvM()
%Yang and Zhang derived an extension to the Garman Glass historical
%volatility estimator that allows for opening jumps. It assumes
%Brownian motion with zero drift. This is currently the preferred
%version of open-high-low-close volatility estimator for zero drift
%and has an efficiency of 8 times the classic close-to-close estimator.
%Note that when the drift is nonzero, but instead relative large to the
%volatility, this estimator will tend to overestimate the volatility.

vol4 = sqrt((Z/n)* sum((log(open(2:end)./close(1:end-1))).^2 + (0.5*(log(high(2:end)./low(2:end))).^2) - (2*log(2) - 1)*(log(close(2:end)./open(2:end))).^2));
end

function vol5 = hrsv()
%The Roger and Satchell historical volatility estimator allows for
%non-zero drift, but assumed no opening jump.

vol5 = sqrt((Z/n)*sum((log(high./close).*log(high./open)) + (log(low./close).*log(low./open))));
end

function vol6 = hyzv()
%Yang and Zhang were the first to derive an historical volatility
%estimator that has a minimum estimation error, is independent of
%the drift, and independent of opening gaps. This estimator is
%maximally 14 times more efficient than the close-to-close estimator.
%It can be interpreted as a weighted average of the Rogers and Satchell
%estimator, the close-open volatility and the open-close volatility.
%The performance degrades to the classic close-to-close estimator when
%the price process is heavily dominated by opening jumps.
muO = (1/n)*sum(log(open(2:end)./close(1:end-1)));
sigmaO = (Z/(n-1)) * sum((log(open(2:end)./close(1:end-1)) - muO).^2);
muC = (1/n)*sum(log(close./open));
sigmaC = (Z/(n-1)) * sum((log(close./open) - muC).^2);
sigmaRS = hrsv();
sigmaRS = sigmaRS^2;
k = 0.34/(1+((n+1)/(n-1)));

vol6 = sqrt(sigmaO^2+(k*sigmaC^2)+((1-k)*(sigmaRS)));

end
end


MATLAB2IB

MATLAB2IB is the product I created along with Exchange Systems Inc, which Connects to the JAVA TWS API from Interactive Brokers. it is socket based. It is much better than ActiveX based programming that IB also Provides. It is more efficient.

MATLAB2IB

provides all the information that you would need.

It includes all the commands that are neccessary for building an automated trading system in MATLAB. (ATS). This gives you a powerful combination of MATHEMATICAL software such as MATLAB and a cheap commissions based broker such as Interactive Brokers.

MATLAB has wide variety of toolboxes available that one could use in building a trading system.

There are a lot of freely available toolboxes .

File Exchange


Interactive Brokers:

InteractiveBrokers


Interactive Brokers API (Application Programming Interface) :

IB API

Friday, June 13, 2008

Trading Interactive Brokers with MATLAB

In This Blog, I will be writing about how to build automated trading systems using matlab and Interactive Brokers. I have previously worked as a Futures Trader and currently work as an Analyst in a Quantitative Strategies Team at a Hedge Fund of Fund.

My Main Interests are in building trading systems that take advantage of several Techniques such as Machine Learning, Artificial intelligence and Market Microstructure.